
Current price and net asset value
Past yields
Past performances don’t guarantee future performances. In addition to examining the retrospective yields, it is also essential to observe the recommended minimum investment horizon.
Infó
Total net asset value of the different investment fund series (data calculated using the compound interest method with a fractional exponent on a 365-day annual basis). Values before deduction of taxes, contributions and distribution costs. The sources of past performances: OTP Alapkezelő (funds).
Presentation of the fund
This is a global mixed fund with an asset mix that has been shifting towards less risky assets over the years.
For whom and for how long investment horizon is it recommended?
The fund is recommended for those who want to hold their investment until 2025.
The recommended minimum investment horizon is 4 years.
Benchmark
- None
Objective of the fund
The fund aims to provide an investment opportunity in a globally diversified mixed portfolio with a steadily decreasing equity and foreign asset mix over time, shifting towards Hungarian and less risky assets.
Investment policy
The fund invests in deposits, equities, government securities, bonds and collective investment schemes investing in these.
The investment strategy is implemented mainly through passive instruments (mostly exchange-traded index funds). The fund’s
investment policy is not linked to a specific sector or asset class.
Portfolio managers
Information on distribution
In accordance with the target date the investment units of the fund are not available any more.

Fund performance
This section provides information on the Fund's past performance.
Infó
The Fund's past performance is no guarantee of future returns. When making an investment decision, it is essential to consider not only historical returns but also the recommended minimum investment period.
Performance for closed calendar years
Past performance of Series A investment unitsThe chart shows the Fund's performance since inception, but for a maximum of the last 10 years, as a percentage of losses or gains relative to the benchmark. Past performance is not a reliable indicator of future performance. Markets may perform very differently in the future. The chart can help you assess how the Fund has been managed in the past.
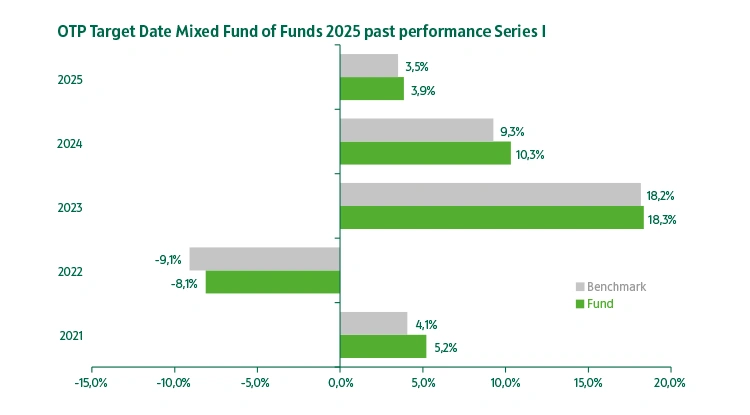
Past performance of Series I investment units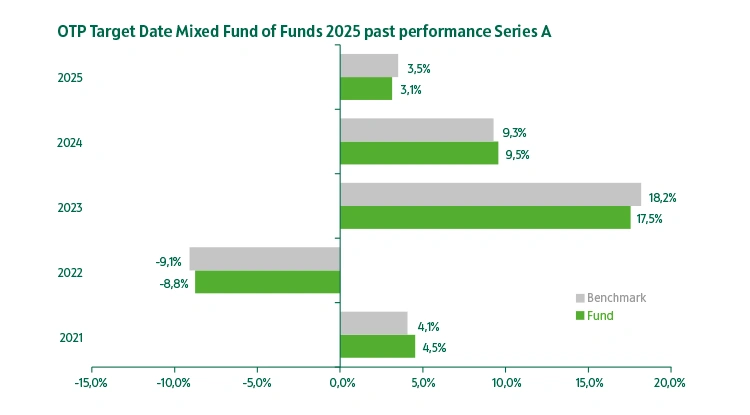 Past performance of Series I investment units
The chart shows the Fund's performance since inception, but for a maximum of the last 10 years, as a percentage of losses or gains relative to the benchmark. Past performance is not a reliable indicator of future performance. Markets may perform very differently in the future. The chart can help you assess how the Fund has been managed in the past.
Past performances
Net returns based on net asset value, expressed as a percentage, annualized returns for periods longer than 1 year (calculated
using the compound interest method, based on a 365-day year). Values before deduction of taxes, contributions and distribution
costs. Source of historical yield data: Bloomberg (reference index) and OTP Fund Management (funds).
Risk indicators
In this section, you will find past performances of the main risk indicators for the fund. The volatility, tracking error,
alfa, maximum drawdown are expressed in percentage.