
OTP Central European Equity Fund
Open-ended, public, Central European, equity fund
I’d like to investCurrent price and net asset value
Past yields
Past performances don’t guarantee future performances. In addition to examining the retrospective yields, it is also essential to observe the recommended minimum investment horizon.
Infó
Total net asset value of the different investment fund series (data calculated using the compound interest method with a fractional exponent on a 365-day annual basis). Values before deduction of taxes, contributions and distribution costs. The sources of past performances: Bloomberg (benchmark) and OTP Alapkezelő (funds).
Buy your investment unit in OTP InternetBank!
You can also buy your investment unit online if you have internet bank access and a securities account at OTP Bank.
DetailsPresentation of the fund
Fund investing in Central and Eastern European equities.
For whom and for how long investment horizon is it recommended?
The fund is recommended for longer-term financial goals and portfolio building for all those who expect a return on their investments from the rising share prices of companies active in the Central European region.
The recommended minimum investment horizon is 5 years.
Benchmark
- 90% CETOP 5/10/40 Index (Bloomberg: CETUC Index)
- 10% MSCI Eurozone 1M-1Y Select Government Bond Index (Bloomberg: MF755433 Index)
Objective of the fund
The aim of the fund is to provide a flexible investment opportunity for longer-term euro or forint funds, available at any time, by outperforming the benchmark index.
Investment policy
The OTP Central European Equity Fund is an actively managed equity investment fund that invests the Fund's assets in the shares of Central and Eastern European companies. The Fund's objective is to outperform the CETOP 5/10/40 UCITS index, which is used as a benchmark portfolio and tracks the Central and Eastern European region, while allowing the Fund's investors to participate in the economic development of the Central and Eastern European region (Poland, the Czech Republic, Hungary, Austria, Romania, Slovenia, and Croatia). In implementing our investment strategy, we apply a value-based approach, seeking to overweight the securities of companies that are undervalued relative to their competitors and their own income-generating potential. The average equity allocation is 90%, which may be adjusted in either direction depending on current market conditions.
Portfolio managers
Awards and recognition
In 2022, the fund won the Privatbankar.hu Best Central and Eastern European Equity Fund Klasszis Award.

Where can you buy investment units?
At OTP Bank
The investment units of the fund are available online or in the branches.
Via OTP InternetBank or OTP MobilBank
You can also buy investment units online if you have internet bank access and a securities account with OTP Bank.
Buy onlineIn person at an OTP Bank branch
Find your nearest securities trading bank branch and make an appointment!
Book on appointmentFrom our distribution partners
You can also buy the investment units from our distributing partners. For more information, see the Fund’s Prospectus and Management Regulations.


Information on distribution
There is no limit on the value of an investment in the fund. You can buy investment units in any amount and increase or decrease the value of your investment as you wish. Moreover, the nominal value of the fund is HUF 1 or EUR 1, so you can easily, flexibly and accurately adjust the value of your investment to the amount you want to invest.
What distribution fees should I expect?Please consult the various distributors’ announcements for more detailed information on the subscription and redemption commission charged by the distributors in relation to the distribution of the fund units and on any other fees and commissions arising in relation to the investment fund (securities account management fee, the transfer fee of fund units, etc.).
How does settlement take place?This is an open-end fund, so its units can be bought and redeemed on any trading day at the net asset value (price) per unit on that day. For the distribution of the units of the fund T+3 days settlement will be used, i.e. the settlement and the crediting of the units will take place on the 3rd trading day (T+3 days) following the order at the price calculated on the basis of the closing price at the end of the trading day (T+1 day) following the order.
Fund performance
This section provides information on the Fund's past performance.
Infó
The Fund's past performance is no guarantee of future returns. When making an investment decision, it is essential to consider not only historical returns but also the recommended minimum investment period.
Performance for closed calendar years
Past performance of Series A investment unitsThe chart shows the Fund's performance since inception, but for a maximum of the last 10 years, as a percentage of losses or gains relative to the benchmark. Past performance is not a reliable indicator of future performance. Markets may perform very differently in the future. The chart can help you assess how the Fund has been managed in the past and compare it to its benchmark.
Past performance of Series B investment units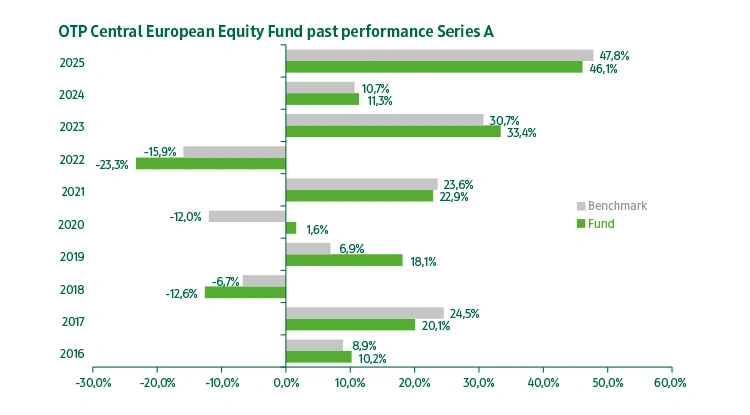 Past performance of Series B investment units
The chart shows the Fund's performance since inception, but for a maximum of the last 10 years, as a percentage of losses or gains relative to the benchmark. Past performance is not a reliable indicator of future performance. Markets may perform very differently in the future. The chart can help you assess how the Fund has been managed in the past and compare it to its benchmark.
Past performance of Series I investment units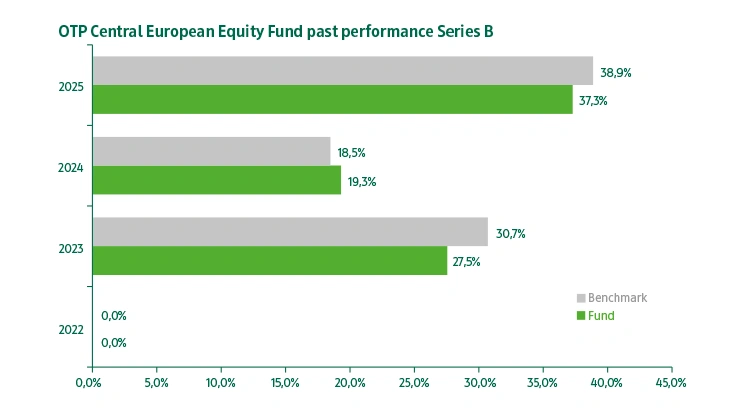 Past performance of Series I investment units
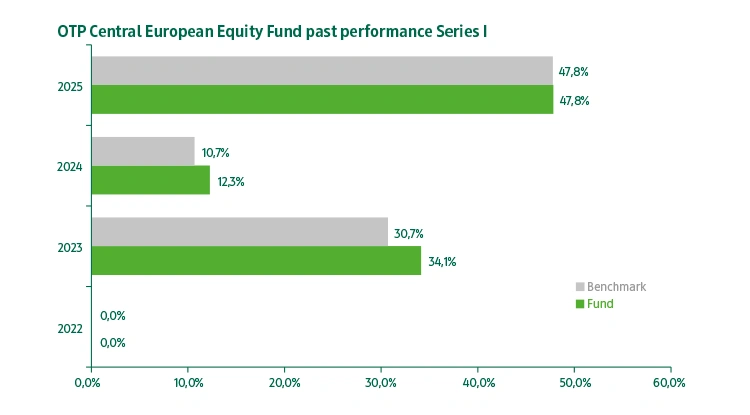
The chart shows the Fund's performance since inception, but for a maximum of the last 10 years, as a percentage of losses or gains relative to the benchmark. Past performance is not a reliable indicator of future performance. Markets may perform very differently in the future. The chart can help you assess how the Fund has been managed in the past and compare it to its benchmark.
Past performances
Net returns based on net asset value, expressed as a percentage, annualized returns for periods longer than 1 year (calculated
using the compound interest method, based on a 365-day year). Values before deduction of taxes, contributions and distribution
costs. Source of historical yield data: Bloomberg (reference index) and OTP Fund Management (funds).
Risk indicators
In this section, you will find past performances of the main risk indicators for the fund. The volatility, tracking error,
alfa, maximum drawdown are expressed in percentage.
Downloads
- Prospectus and Fund Management Policy in force
- Prospectus and Fund Management Policy in force - Bulgarian